Sprint Dynamics Close Up
One of the things I am trying to achieve is some understanding of the dynamics of book production especially with regard to Book Sprints. The tool used for Book Sprints is Booktype, an online Book Production platform that I currently project manage. Booktype records all actions by writers/illustrators etc. Until recently this information has been latent – stored in the database but with little utility. This is obviously very useful information, not just for Book Sprints but for understanding book production in general as it is an area that is surprisingly under researched. However in the last few weeks Juan Carlos Gutiérrez Barquero and I have been working on extracting that data and finding good ways to visualise it. One task was for Juan to take the sketches I had made from the Data Ecologies sprint (see below) and remodel that using the data taken from Booktype. Two weeks later and we have a good beta version.
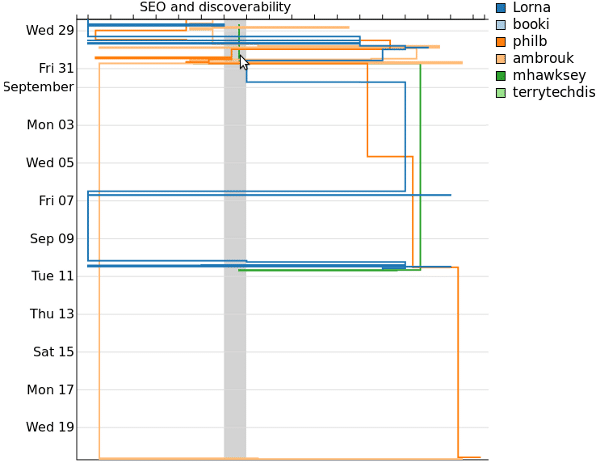
The above image shows the chapter names at the top (visable with mouseover) and the colored lines are the persons that have worked on a chapter over time (displayed on the y axis).
The above Book Sprint occurred over 3 days in September 2011 and you can see that the majority of the collaborative activity was in these 3 days with some ongoing work after the sprint by a subset of the Book Sprint participants and one person who was not at the sprint.
This shows the life of the book extended beyond the Book Sprint which is one of the things Book Sprints try to achieve – the ongoing development of the book through the community that formed during the sprint itself. It also shows the successful extension of the mandate to produce the work since there is one new person that started work on the book after the sprint was completed.
When we double click on the visualisation we can zoom in and see the same data on another time scale.
The above view is not only interesting from a historical perspective but it is very useful information to be able to access in realtime to assist the facilitation of a Book Sprint. This can help understand the dynamics of the team and help identify where too much or too little energy is being committed.
This is just the first step in drawing out information about how Book Sprint dynamics work but we will extend this first beta with more information and possibly also look at ways of annotating these graphs with event information so it is possible to co-relate activity with facilitator or group directives.


